EVERYTHING, EVERYWHERE, ALL AT ONCE
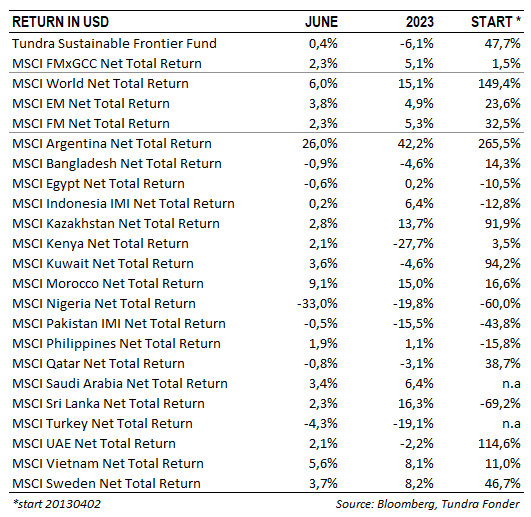
In USD the fund rose 0.5% (EUR: +3.4%) during the month, compared to MSCI FMxGCC Net TR (USD), which fell 0.8% (EUR: +2.1%), and MSCI EM Net TR (USD)which fell 1.7% (EUR: +1.2%). In absolute terms, the largest positive contributions came from Vietnam (+1.2%), Nigeria (+1.1%), and Sri Lanka (+0.7%), while Pakistan (-1.3%), the Philippines (-0.9%), and Morocco (-0.4%) were the three largest negative contributors.
In USDthe fund rose 0.4% (EUR: -1.7%) during the month, compared to MSCI FMxGCC Net TR (USD), which rose 2.3% (EUR: +0.2%)and MSCI EM Net TR (USD)which rose 3.8% (EUR: +1.7%). It was an eventful month in our markets, with some unexpected events that weighed temporarily but may have marked the turning point for the year. Measured in absolute return, the largest negative contribution at the country level came from Nigeria (-1.3%). After several years of currency restrictions, the country finally allowed its currency to float which resulted in a devaluation of 40%. Strongly rising share prices mitigated the decline, but our sub-portfolio fell during the month by just over 20% (read more below). Positive absolute contributions were obtained primarily from Vietnam (+0.7%), the Philippines (+0.5%), and Egypt (+0.4%). Relative to our benchmark, our largest positive contribution came from Nigeria (+0.9%)as our portfolio significantly outperformed the market as a whole. The Philippines (which is not part of our benchmark) contributed + 0.5% and the absence of holdings in Jordan (which fell 24%) contributed +0.4%. The largest negative contribution relative to the index was obtained from Vietnam (-1.0%)where our sub-portfolio rose only 3% while the market as a whole rose 6%. Our underweight in Morocco (2.7% vs. the index 13%) cost around 0.8% as the market rose 9% during the month. Furthermore, the absence of holdings in Romania, Slovenia, and Iceland meant a further 1% underperformance as these markets performed strongly during the month.
It was an eventful month in our markets. Nigeria has been a zombie market for several years with low expectations of any relevant improvements. The free-floating of the naira was the single most important event during the month. Although the decision meant short-term pain for investors, it represents a major step towards making Nigeria investable again. For several years, Nigeria has implemented a queuing system for foreign investors who want to repatriate cash. It has eliminated foreign interest in both the country’s bond market, stock market and through FDI. Initially, investors will be sceptical and want to ensure that the measures are not reversed. As we wrote in last month’s newsletter, the timing of the measures taken (both the fuel subsidies and the foreign exchange market) suggests that they may be permanent. If so, Africa’s largest economy will reopen as a potential investment destination for foreign investors. Nigeria is a good example of how difficult it can be to time our markets. Despite a devaluation of 40%, our Nigerian sub-portfolio is up 11% in USD this year, 7% in the last 12 months and 37% in the past three-year period.
Pakistan was closed in the last days of the month and meanwhile the government was able to secure an agreement with the IMF on a 9-month standby agreement amounting to USD 3 billion. The loan means that the discussions with other multilateral and bilateral lenders are simplified and may mean that a debt restructuring is avoided in the near term. The fact that a temporary solution has been reached also indicates that the IMF received reasonable explanations regarding how the country intended to deal with the elections that are planned for this autumn. The announcement led to a sharp rise in bond prices and the equity market rose sharply during the first trading day in July (+6%). It is a long way back to the average valuation levels seen over the last 5 and 10 years, however. At the end of Junethe equity market was trading at a P/E of 4x, compared to 7x on average over the past 5 years and 9x on average over the past ten years. For valuations to normalize requires that elections will be held in the autumn and that there will be a somewhat acceptable outcome with a government that can restore investor confidence. Current valuation levels, however, signal extremely low expectations that seem difficult to fall short of.
Sri Lanka also found itself in the headlines. As part of the restructuring of the country’s foreign debts, it has also had to review its domestic debts. The domestic debt optimization plan was presented at the end of June. The market breathed a sigh of relief when the banks’ holdings of LKR-denominated treasury bills and bonds were excluded from the restructuring plan. This may mean that the market avoids a series of recapitalization measures in the listed banks and that confidence in the stability of the financial system increases. In combination with falling inflation (June’s inflation came in at 12%) and increased expectations that the central bank will continue to lower interest rates, the optimism on the ground is growing. With June’s monthly inflation figure, we note that the country now has a positive real interest rate (policy rate of 13.5%).
Vietnam was also in the headlines when the key interest rate was lowered by 50 basis points to 3.75%. Additionally, VAT (mainly on edible items) was lowered from 10% to 8% as of July 1, to support private consumption.
HOW ARE OUR PORTFOLIO COMPANIES FARING?
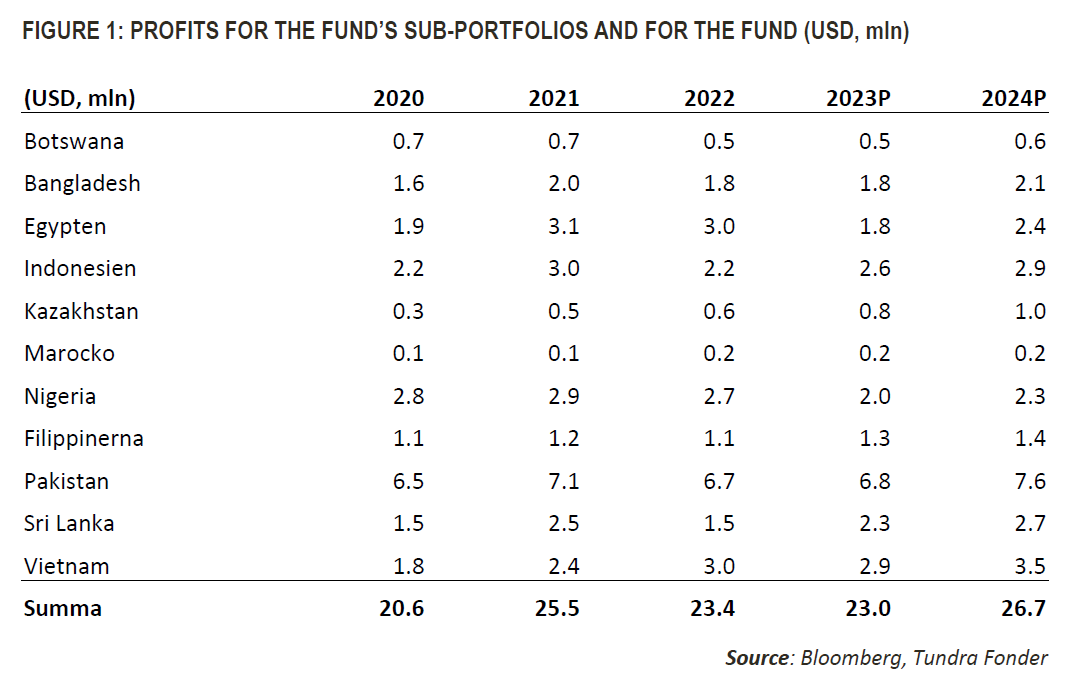
In our March newsletter, we had a special section on how historical profits and future profit forecasts look like in our portfolio companies. The purpose of this is to illustrate the difference between price performance and actual fundamental performance across our portfolio companies (See monthly newsletter March for background). As we wrote then, we will update this quarterly so that you, as an investor, can follow the companies’ fundamentals but also the market’s expectations going forward. For the slightly nerdier reader, there are some useful data that we think you will like. The distribution of profits between our various sub-portfolios differs a lot from our country allocation. For example, in 2022, we generated 12% of the portfolio profits from Nigeria, despite the country constituting only 4% of the AuM. Whereas only 13% of the portfolio profits came from Vietnam despite the country constituting 26% of the AuM. The reason, of course, is that Nigeria’s valuations were very low, while Vietnam has enjoyed significantly higher valuations.
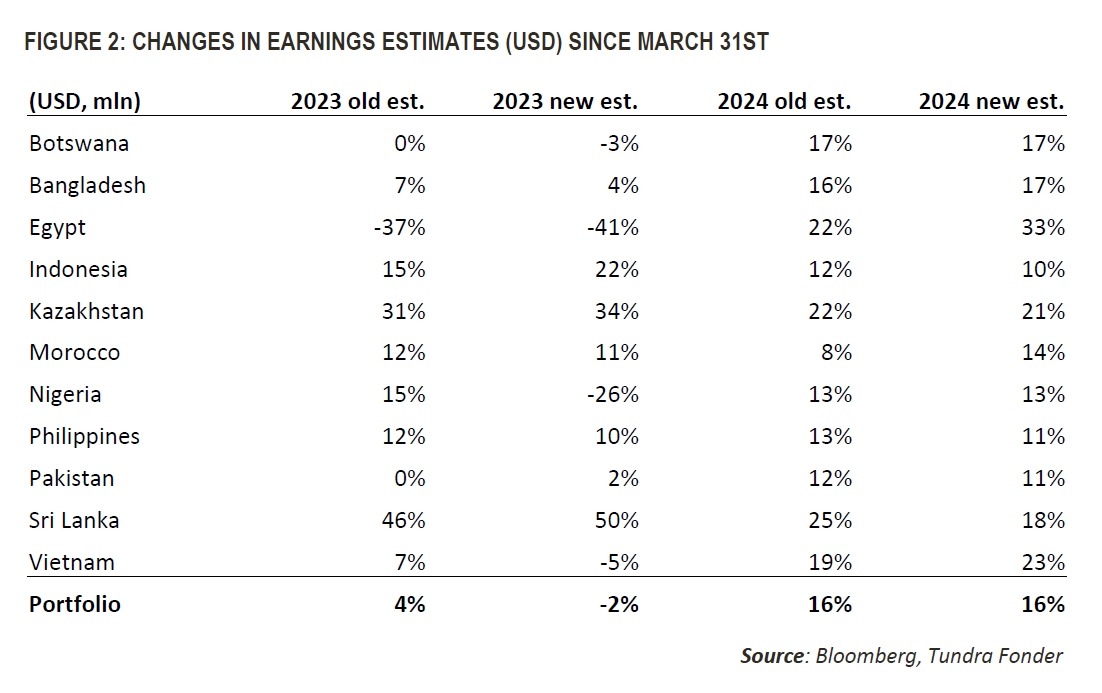
As explained in the March letter a fund’s consolidated earnings are the sum of all shares times the earnings per share of each share owned. Given that the fund trades daily and we continuously buy and sell shares, an absolute comparison with March 31st risks being misleading. Instead, in Figure 2, we show a table of how the profit expectations have changed since March 31st for the estimates for 2023 and 2024.
As can be seen from the table, the estimate for the portfolio companies’ profits for 2023 has been revised down, from an increase of 4% to a decrease of 2%. The main reason is, of course, Nigeria which recently devalued its currency by 40%. We also note downwardly revised estimates in Vietnam, where it is mainly the profit estimates in our consumer-oriented holdings (Mobile World and Masan) that have seen their profits adjusted down given the continued tough local environment. We note marginal downward revisions to earnings in Botswana, Bangladesh, Egypt, Morocco, and the Philippines, while we note marginal upward revisions to portfolio companies’ earnings in Sri Lanka, Kazakhstan, and Pakistan. If we look at the 2024 estimates, they are generally unchanged, but from a slightly lower base. We see upward revisions in Egypt and Morocco, while we note a decrease in Sri Lanka.
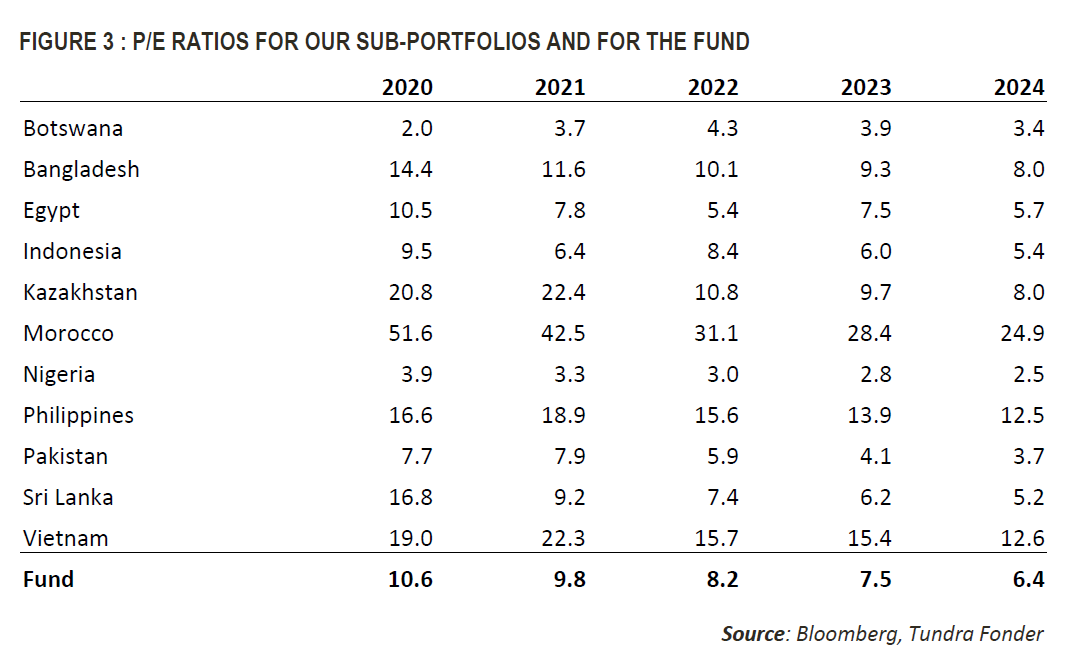
Finally, when we look at the valuations for 2023 and 2024, these have risen marginally since March 31st (then P/E 7.1x for 2023). But as we see in the table, the exact same portfolio was valued roughly 30% higher at the end of 2021, and 41% higher at the end of 2020. Tundra’s thematic focus on low-income and lower-middle-income countries has been in the eye of the storm during the last 12 months but our companies have fared the crisis well and we now see how their environment is gradually improving. We have said before that we expect the second half of the year to be significantly better than the first half of the year. That view is unchanged.
___________________________________
TUNDRA SUSTAINABLE FRONTIER FUND REPLACES THE SWAN WITH THE EU’S REGULATIONS FOR SUSTAINABILITY
In connection with the new EU regulation under the Sustainable Finance Disclosure Regulation (SFDR), new requirements are applied to funds’ sustainability work as of March 2021. Tundra has therefore decided on July 4 not to continue with the Nordic Ecolabelling of the fund. According to the new regulations, sustainability reporting must take place in a uniform manner and funds are divided into different categories. The Tundra Sustainable Frontier Fund is classified as an Article 8 fund (Light green: promotes environmental or social characteristics). The investment philosophy of the fund remains the same; management of the fund and is not affected by the change.
DISCLAIMER: Capital invested in a fund may either increase or decrease in value and it is not certain that you will be able to recover all of your investment. Historical return is no guarantee of future return. The Full Prospectus, KIID etc. are available on our homepage. You can also contact us to receive the documents free of charge. Please contact us if you require any further information: +46 8-5511 4570.