CONTINUED HEADWIND DURING THE MONTH OF MARCH
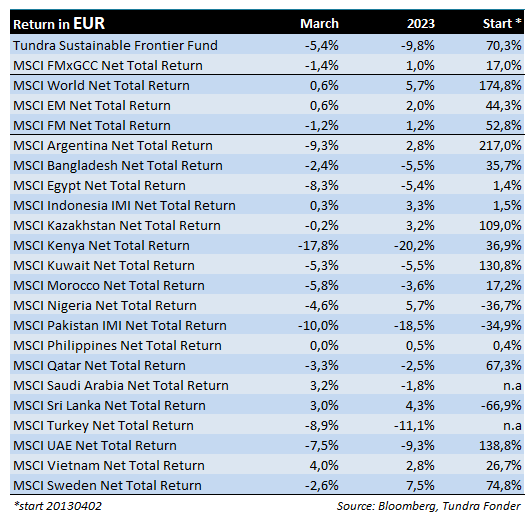
In USD, the fund fell 3.1% (EUR: -5.4%) compared to the fund’s benchmark index MSCI FMxGCC Net TR (USD), which rose 1.0% (EUR: -1.4%), and MSCI EM Net TR (USD) which rose 3.0% (EUR: +0.6%). We lost 1.8% in Pakistan, where the sub-portfolio fell 10%, in line with the broader market. Further, we also lost just under 1% each in Egypt and Indonesia, where our sub-portfolios fell 8% and 12%, respectively. We received a 0.7% positive contribution from Sri Lanka, where the sub-portfolio rose 12% during the month.
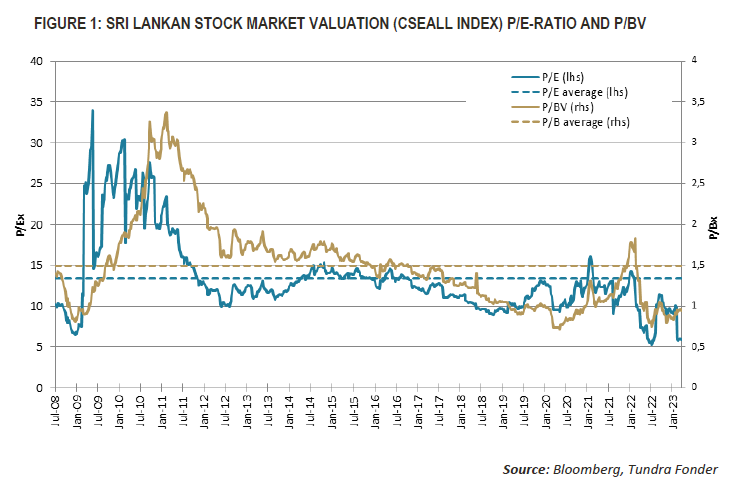
In the middle of the month, the IMF approved a new loan program for Sri Lanka. This is after putting together a comprehensive plan, which includes restructuring of the country’s foreign debts and parts of domestic debts, tax increases, and the abolition of subsidies, as well as a preliminary restructuring plan for some of the country’s state-owned companies. There are still some details missing regarding how the restructuring of the country’s domestic debt and bad loans may affect the weak banks. More details will come in late April/early May. The negotiations with the IMF have taken time but have also involved an unusually comprehensive plan that will likely be received positively by foreign investors. Now that tourism is also on the way back, there are many indications that Sri Lanka is beginning its recovery. Sri Lanka was the first of our countries to enter the crisis and now appears to be the first country to emerge from the crisis. Both the stock and (especially) the currency markets are among the world’s best so far in 2023, but it is a long way back to more normal valuations (see Figure 1). We are optimistic about the development of the coming years, not least from a stock market perspective.
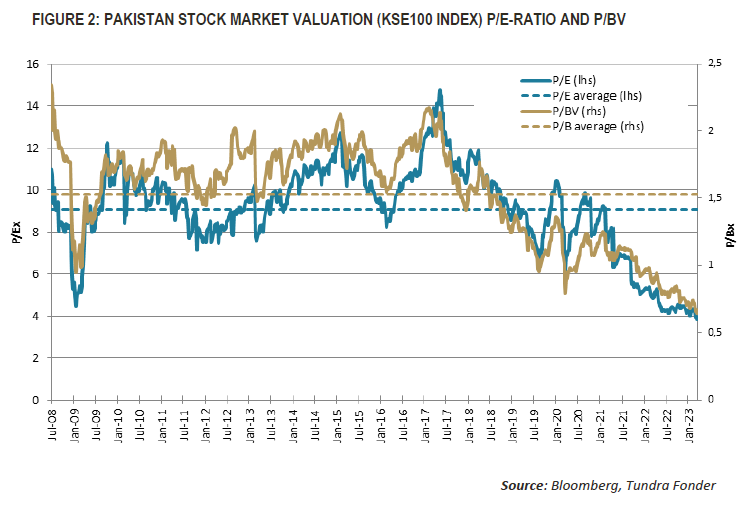
In Pakistan, negotiations with the IMF continue. These are likely to be made more complicated by the troubled political climate where the current government is trying to negotiate with the IMF and its bilateral lenders, while their credibility (internally as well as externally) is very low given non-existent political support. The government’s focus seems to be primarily to ensure that the former Prime Minister Imran Khan is kept out of power, regardless of the cost to the country. This means concerns regarding the autumn’s scheduled elections will be delayed by the government are partially justified. However, the situation in Pakistan is unique as compared to its history. There has never been a party with such huge and wide support as Imran Khan’s PTI. The party is particularly strong among the young population. Every year, 3-4 million people are added to the eligible voter pool, where almost everyone can read and follow what is happening in Pakistan and the rest of the world. Even if something should happen to Imran Khan, it will thus be next to impossible to reverse the political change that is taking place. Thus, after the current political farce ends, a strong and sustained change may come, this time of a more permanent nature. Pakistan’s stock market has more than discounted the current crisis, including a potential debt restructuring. Sri Lanka is a near-term relevant example of an absolute worst-case scenario, where the economy was completely shut down for a year. Pakistan is not there yet but has already discounted something significantly worse. The trigger for a sustained turnaround in the stock market remains likely the announcement of new elections, and the extremely low valuations mean that the subsequent rally could be strong. However, it remains to be seen from which levels it takes place.
WHAT IS UNDER THE HOOD?
Ten years ago, we started the Tundra Sustainable Frontier Fund. From the start, we have always tried to be as transparent as possible about what we own, and why. This month we take another step in this strive for transparency by publishing a quarterly update of the profit estimates for the portfolio as a whole, and for the individual countries in which we have invested. It is our hope that our investors will thus get a better picture of how the companies are actually doing and what the valuation looks like. However, let’s start by explaining the basics of this exercise.
HOW DO YOU CALCULATE THE P/E OF A FUND?
When we talk about P/E ratios for the fund, we use the so-called Harmonic P/E method. By multiplying the profit per share by the number of shares held by the fund, you get the total amount of profits for the fund as a whole. The fund’s net asset value is then divided by this amount. It may sound complicated but is the only correct way to calculate a fund’s P/E ratio. Let us explain why: Say you own two companies in the portfolio, 100 shares in Company A, and 100 shares in Company B. Price per share is USD 100 for both shares, i.e. you have invested the same amount in both companies (total USD 20 000). Company A valued at P/E 10x (earning USD 10 per share), and Company B is valued at P/E 20x (earning USD 5 per share). What is the P/E ratio for the portfolio? Some would spontaneously say P/E 15x, i.e., 50% x P/E 10 + 50% x P/E 20. The correct answer, however, is about 13.33x. Why? Well, because “your” profit based on the shares you own is a total of 10 x 100 + 5 x 100 = USD 1 500, and USD 20 000 / USD 1 500 = 13.33. This is your share of the profits these companies generate, and WHICH you are entitled to as a shareholder – the number of shares you own times the profit each share generates. The easiest thing to do is to imagine yourself in the scenario that you were the sole owner of both companies, which is what you assume when calculating the value of a share. How big would your return be as a sole proprietor? Yes, USD 1 500. What return do you get on the shares? 7.5%. If the P/E ratio were 15x, your return would be 1/15 = approx. 6.7%, i.e. USD 1 333, which does not match up with reality.
HOW DO WE CALCULATE THE PORTFOLIO’S CORPORATE PROFITS?
We use official estimates to the extent it is possible. It gives a more neutral image and reduces the risk of rationalization (when you change your reality so that it better coincides with how you’d like it to be). For 10 of our 38 companies, estimates for 2023 are missing, or the estimates are undoubtedly incorrect. For 2024, the number of companies for which estimates are missing is 11. When there are no official estimates, or the estimates are clearly incorrect, we use our internal estimates.
Next, we need to take into account that we own companies from many different countries and the shares are traded in different currencies. So all profits are converted into a common currency, US dollars. To simplify comparisons between different years, we use exchange rates at the end of the year (the standard is to use the average exchange rate). For 2023 and beyond, we use the current exchange rate, i.e. we do not incorporate exchange rate assumptions. You can do that yourself, however.
We also need to take into account that our companies have different financial years. Many Sri Lankan companies’ financial year end on 31/3, and most Pakistani companies end on 30/6. Some companies use calendar years, just as is customary in Sweden. Our model recalculates all profits to calendar years.
HOW CAN THIS BE USED?
In the long term, the companies’ profit trajectory drives their share prices. Long periods may pass when this is not the case. During market turmoil, investors become fearful and exit far below fundamental values. In times of optimism, investors become greedy and push prices beyond what is fundamentally warranted. However, the long-term price of a share always follows the earnings trend. As long as the companies continue to grow, periods like today, where many investors are afraid can be excellent periods to increase your investment. We hope the quarterly updates will give you, as an investor, a greater understanding of how the companies are doing and allow a better understanding of opportunities and risks ahead.
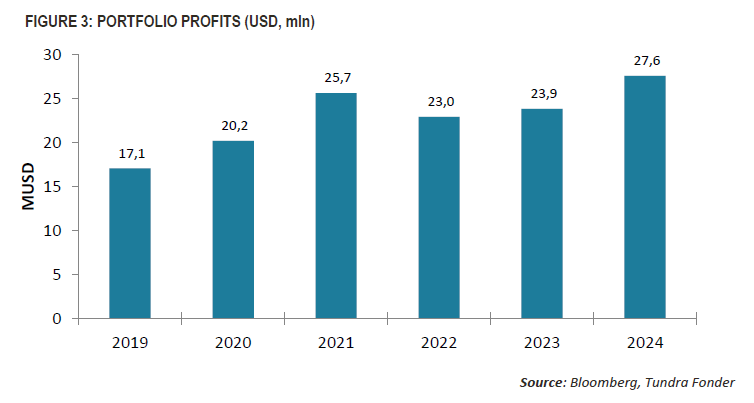
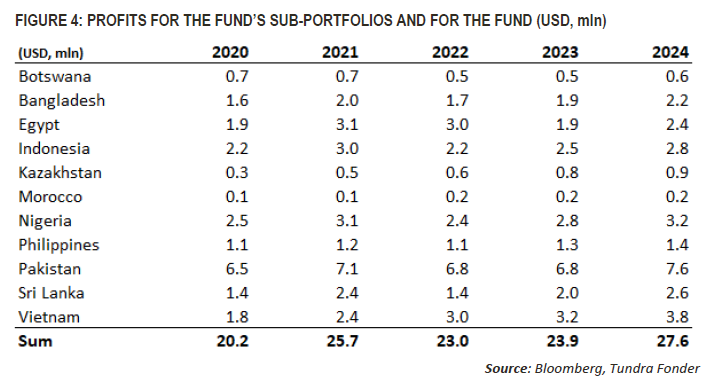
The fund assets at the end of March 2023 were USD 174m. This means that the P/E ratio for the current year is 7.1x. For 2023, we expect consolidated earnings to rise by 4% in USD. This takes into account both Egypt’s (7% of the portfolio) and Pakistan’s (16% of the portfolio) local currency devaluations against the US dollar in 2023 of 20% each. This figure can also be broken down at the country level to see where the profits are generated (see Figure 4).
Here you can see how our portfolio companies fared during a difficult 2022. With few exceptions, most companies have reported their earnings and we have a somewhat fair picture of the outcome. In Indonesia, portfolio profits decreased by nearly 30%, mainly because our healthcare company, Hermina Hospitals, experienced a drop in earnings as they no longer treat COVID patients. As expected, the profit decline in Sri Lanka (calculated in USD) was substantial, given that the currency lost 45% against the dollar during the year. Despite a currency weakening of 22% against the dollar, profits in our Pakistani portfolio companies fell by only 4%. This is because nearly 50% of our exposure in the country comes from an IT company, which generates 85% of its total revenues in foreign currency (mostly USD). Another 30% are banks that net profited from the higher interest rates. The most profit increase in 2022 came from Vietnam, where our three largest exposures (the IT company FPT, the largest listed renewable energy company Ree Corp, and the airport terminal operator Airports Corporation of Vietnam) all showed significantly higher profits. For 2023, it is mainly Egypt that is expected to have a difficult time. One reason for this is partly the exchange rate loss (20% against USD so far in 2023) but also very low expectations for our largest holding, GB Auto.
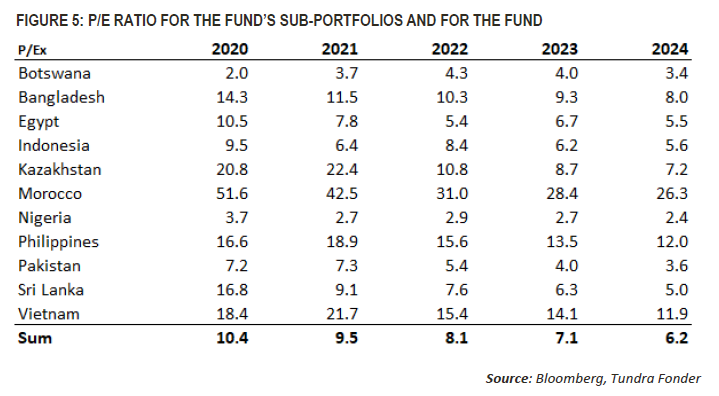
From a unitholder’s perspective, the data can also be used for stress testing if you have other expectations. If you believe, for example, that Pakistan will devalue another 20% without the companies managing to compensate in their pricing for this, then the portfolio profit falls by 6% and the P/E ratio for 2023 rises to 7.7x and so forth. The idea is to update the profit estimate every quarter going forward so that you, as an investor, thus get a regular update on how the portfolio companies are performing and how expectations change locally. Based on the values of our various country portfolios, it is also possible to calculate P/E ratios per country, and we conclude in the table below (Figure 5).
Worth noting here is that historical P/E numbers, up to 2022, have been calculated based on the share price at the end of each year and assume that the same number of shares were owned throughout the period. For the fund as a whole, it can thus be noted that the valuation today is roughly 20% lower than at the end of 2020 for the same holdings. Assuming that our estimates for 2023 are correct, the discount rises to roughly 30%. We also note that our portfolio companies in Sri Lanka at the end of 2022 were valued at less than half of what was the case at the end of 2020, likewise in Egypt. The generally low valuations can be explained by investors’ concerns, and some of our markets have continued uncertainty ahead. The profit estimates may thus come down further. However, we have quite a decent amount of room for the profits to come down without our markets becoming expensive from a historical perspective. And just as Sri Lanka showed (the market bottomed about 1 year ago) reversals tend to come before the actual fundamental improvements occur. Despite the weak start to the year, there is thus reason to be optimistic, rather than pessimistic, about the value that can be generated from here.
______________________________________________________________________
TUNDRA SUSTAINABLE FRONTIER FUND REPLACES THE SWAN WITH THE EU’S REGULATIONS FOR SUSTAINABILITY
In connection with the new EU regulation under the Sustainable Finance Disclosure Regulation (SFDR), new requirements are applied to funds’ sustainability work as of March 2021. Tundra has therefore decided on July 4 not to continue with the Nordic Ecolabelling of the fund. According to the new regulations, sustainability reporting must take place in a uniform manner and funds are divided into different categories. The Tundra Sustainable Frontier Fund is classified as an Article 8 fund (Light green: promotes environmental or social characteristics). The investment philosophy of the fund remains the same; management of the fund and is not affected by the change.
DISCLAIMER: Capital invested in a fund may either increase or decrease in value and it is not certain that you be able to recover all of your investment. Historical return is no guarantee of future return. The state of the origin of the Fund is Sweden. This document may only be distributed in or from Switzerland to qualified investors within the meaning of Art. 10 Para. 3,3bis and 3ter CISA. The representative in Switzerland is OpenFunds Investment Services AG, Seefeldstrasse 35, 8008 Zurich, whilst the Paying Agent is Società Bancaria Ticinese SA, Piazza Collegiata 3, 6501 Bellinzona, Switzerland. The Basic documents of the fund as well as the annual report may be obtained free of charge at the registered office of the Swiss Representative.