THE FUND
The fund fell 5.3% in June, compared to MSCI FMxGCC Net TR (SEK), which fell 0.3% and MSCI EM Net TR (SEK), which rose 3.5%. About 2.5% of the fund’s underperformance came from Pakistan, where the market fell 15%. Towards the end of the month, the country’s budget was voted through, which opens up for a signed agreement with the IMF. This has traditionally meant the starting point of a more constructive equity market. Our lack of holdings in Romania and Morocco had a negative contribution of about 0.6% and 0.5% respectively, and our positions in Egypt, Turkey, and Sri Lanka had a negative contribution of about 0.3% each. During the month, the fund sold its smaller holding in Vietnamese Mobile World Group (0.4%). The very high premium for foreigners has deterred us from building a meaningful position, which meant that we instead chose to divest of the holding.
The fund’s investment philosophy, which is focusing on fewer but less affluent and less economically developed countries, has had a difficult time in 2019. Investors have avoided what they consider more risky markets and, in particular, avoided medium-sized and small companies in these markets. We have talked about this in our previous monthly letters. We have pointed out the low valuations and thus good conditions for strong annual returns from current levels in the coming years. In this monthly letter, we are going to explain a little more closely what makes us claim this.
As we all know, the growth of companies goes into cycles. Strong periods are followed by weaker, but the large majority of companies are growing in the long term. An active selection further increases the probability for this. Individual bad years are, in the long run, quite uninteresting as long as the long-term trend is intact. Inferior years tend to be followed by better years that compensate.
One might think that the equity market after a couple of hundred years of practical experience dealing with this reality would take this into account, but the fact that equity markets sometimes move + 30%, and on other occasions -30%, tells us that is not the case. For some reason, many investors tend to chase markets that are performing well and avoid markets that underperform. As a wise person once put it: “The equity market is the only market where investors run towards the exit when it is a sale”. However, for long-term investors, these fluctuations mean opportunity, where one should increase exposure during periods when the market is pessimistic and reduce exposure when most investors are too optimistic. The theoretically most correct way of making an assessment of whether a stock is cheap or expensive is, of course, traditional discounted cash flow analysis, which calculates the present value of all future cash flows. A somewhat simpler method that intuitively can be a little bit easier to understand is to insert assumptions about future growth and an assumption of what is a reasonable profitability over a cycle to see how the valuation of the company looks a few years ahead in the future. If one compares this with the market’s historical valuation of the company, one can form an estimation of where the share will trade in a normal market situation.
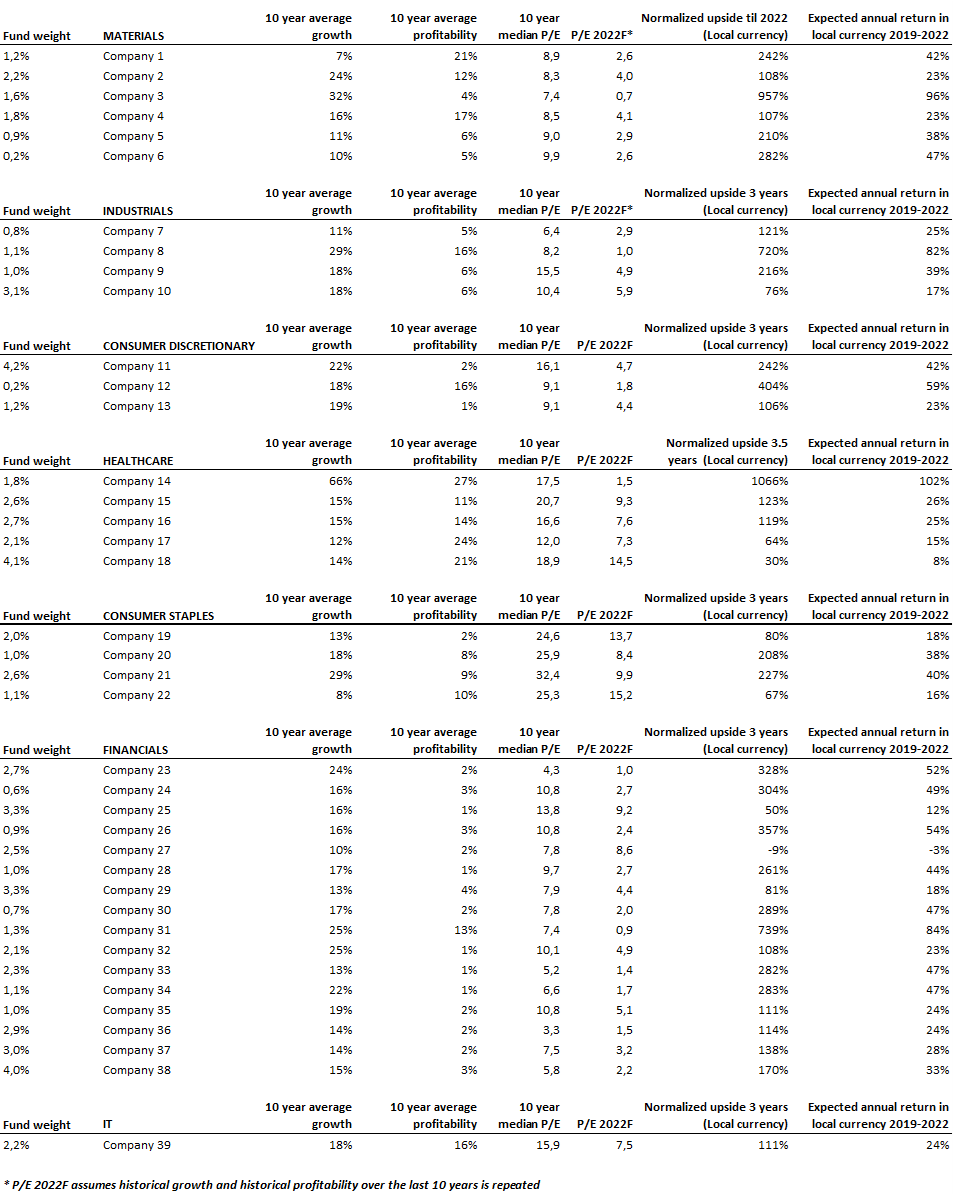
We used this method for the existing holdings in the Sustainable Frontier Fund. As limitations, we set that there must be ten years of history. 39 out of the fund’s 51 holdings, corresponding to 74% of the fund’s assets, were able to show this. We cleared companies that either had a shorter history than 10 years (e.g. Turkish Medical Park which was listed at the beginning of 2018) or whose operations changed so much that historical sales growth and profitability were not considered relevant for forward-looking purposes (e.g. Vietnamese FPT which just over a year ago spun off its retail business, turnover was halved but profitability doubled in connection with this).
It might sound strange from where we stand with all the negative headlines that currently concern our markets, but for most of our companies, their realities remain approximately the same as they have been for the past ten years. Their markets are still underdeveloped, demand is large and is increasing as more people become consumers. Individual tough years are followed by better years, but the long-term demand for their goods and services continues to grow a great deal faster than corresponding goods and services in our part of the world. We have thus assumed that their historical average growth over the past ten years, portfolio as a whole, is reasonable to expect even in the next 3.5 years (Until the end of 2022, broken fiscal year for many of them). For companies in the Financial sector (mainly banks), the figure shows growth in total assets, while for other companies the measure shows revenue growth. We have then looked at historical profitability over the past ten years, an average of good and slightly worse times. We measure this as median to prevent individual exceptional or bad years to have too much of an impact. For the Financial sector, we have chosen the measure return on total assets, for other companies the average net margin is shown. Then we have looked at the average P/E valuation over the last ten years, as an indication of what investors have been prepared to pay for the company over a cycle. Not peak valuations, but on average in good and bad times. Finally, we have looked at how the company, based on its current market cap, is valued at its normalized profit in 2022, assuming it grows in-line with the previous ten-year-average and shows the same profitability. We arrive at a tentative upside over the next 3.5 years based on these assumptions. The calculations cover only 74% of the portfolio, but given that it is distributed among 39 companies over 7 markets where not a single company constitutes more than 4.5%, we think it is sufficiently representative of the portfolio as a whole.
With these assumptions, we see a theoretic 37% average annual return over the next 3.5 years in local currency from current levels. However, this is in local currency. It is reasonable to expect, over time, that the currencies in our core countries will weaken against the US dollar, although the sharp weakening of recent years may indicate more weakening in line with the inflation differential. We should also keep in mind that the USD has been strong against most currencies around the world. Further on, if we still assume a 5% annual average depreciation, we will arrive at an average return of about 30% per year in USD. One can of course point to individual positions and say that, for example, the pharmaceutical company with a historical sales growth of 66% is unlikely to be able to maintain that for the next three years. If we remove all positions with an upside of more than 500%, expected annual returns will fall to 26% (20% in USD). But now we are starting to be quite cautious. In the fairly well-diversified portfolio, it is likely that there will also be companies that deliver more than their historical growth and profitability. It should also be added that out of the 39 companies, only 3 companies have lost money during a single fiscal year over the past 10 years and the median growth in turnover/assets amounts to approximately 16% in local currency. The portfolio’s current average P/E valuation of about 7x should be seen in this context.
This is a simplified method which should be seen as an example of what we internally call a “reality check” where we leave our own assumptions aside and only look at what our companies have delivered historically. Keeping this in mind, one can then adjust ones’ assumptions based on how optimistic or pessimistic one is.
What we do want to emphasize is that investors are too pessimistic right now. Investors have a tendency to think “this time it is different”, in good times as well as in bad times. Our imagination has no limits when we seek for arguments regarding why historical market cycles will be broken. In October 1998, when the Russian stock market had lost more than 90% in one year, it was talked about the risk that General Lebed would come to power and push the nuclear weapon button. In the IT boom 1999-2000, gurus in fleece shirts explained how newly graduated computer engineers were actually worth a few million dollars per person. In the commodity boom of 2005-2007, China’s consumption growth was extrapolated to a level where all coal and oil would run out, in 2008 we talked about the global financial system ending and a reboot of the world economy. The truth tends to be somewhere in between and no trends, neither bear trends nor bull trends, last forever. In the same way as the clock turns twelve two times every 24 hours, markets regularly return to a normal position. Without in any way claiming that current levels constitute the bottom of this bear cycle, one still has to question whether the pessimism is really justified or if we once again stand in a position where the truth again is somewhere in between. In Sweden we have a word for it: “Lagom”. Google it.
ESG ENGAGEMENT
The Vietnamese company, Mobile World Investment Corporation, was divested in June due to financial considerations. No new company was added to the fund this month.
DISCLAIMER: Capital invested in a fund may either increase or decrease in value and it is not certain that you will be able to recover all of your investment. Historical return is no guarantee of future return. The Full Prospectus, KIID etc. are available on our homepage. You can also contact us to receive the documents free of charge. Please contact us if you require any further information: +46 8-5511 4570.